Traffic Quality Guide for Smarter Marketing Decisions
Most website owners look at their analytics and see one number that makes them smile. Total visitors. If that number goes up, they assume things are going well.
But here is what I have learned after years of helping businesses grow online. That number can be dangerously misleading.
You can have thousands of visitors and zero sales. You can also have fifty visitors and five paying customers. Which scenario sounds better? That is why traffic quality matters more than traffic volume.
Master how to measure website traffic quality right with key metrics and practical insights that help you make smarter marketing decisions.
Why Not All Visitors Are Equal
Some visitors arrive ready to buy. Others are just browsing. Some stay for minutes. Others leave in seconds. Some come back. Others never return.
Your job is to understand which visitors actually move your business forward and which ones just fill up your reports.
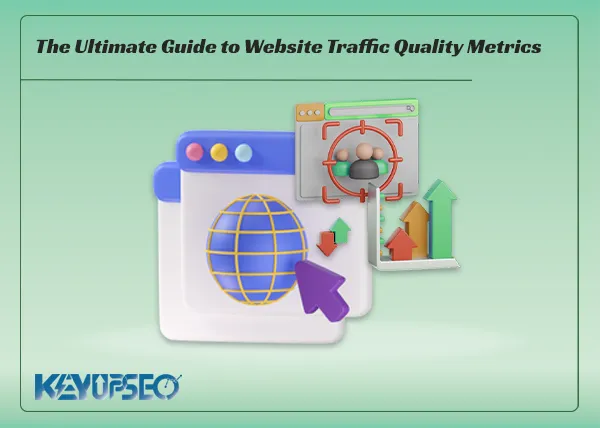
The ultimate guide to traffic quality metrics covers what to track and how to measure real visitor value.
If you are looking to expand your reach in specific regions, some businesses choose to India website traffic through platforms like KeyUpSEO to test how different audiences behave on their site before scaling their content strategy.
What This Guide Covers
In this guide, I will walk you through the metrics that actually tell you something useful. No vanity numbers. Just the ones that help you make better decisions about where to invest your time and money.
Let us start with the first metric that most people get completely wrong.
Why Total Visitor Count Is a Vanity Metric
Here is something I learned the hard way. Total visitors look great in reports and impress people who do not understand analytics. But they rarely tell you anything useful about your business health.
Think about it this way. A thousand visitors who leave after two seconds do nothing for your revenue. Fifty visitors who stay, read, click around, and buy something are far more valuable. Yet most dashboards treat both the same way.
Why Visitor Numbers Can Be Deceiving
Real traffic comes with real human behavior. Natural patterns like scrolling, pausing to read, clicking internal links, spending time on pages, and returning later. These are the signs of genuine interest.
Without these natural behavior patterns, traffic is just noise. High visitor numbers with no engagement, no time on site, and no interaction are worthless. They might look good on a screen, but they do nothing for your business.
Vanity Metrics vs Actionable Metrics
That is what makes total visitor count a vanity metric. It feels good to look at. It makes you feel like your site is growing. But without understanding how visitors actually behave, the number gives you no direction.
For example, if your total visitors double this month, what do you do next? Do you publish more content? Do you change your design? Do you run more ads? The number alone gives you no answer.
That is why smart marketers look past total visitors. They focus on behavior-based metrics that actually tell them what is working. Metrics that lead to action, not just pride.
Let me show you those metrics next.
Bounce Rate: The Most Misunderstood Metric
Bounce rate gets a bad reputation. Most people see a high number and panic. But the truth is more complicated.
Here is what bounce rate actually means. It is the percentage of visitors who leave after viewing only one page. That is it. No judgment about whether they found what they needed. No measure of satisfaction.
When High Bounce Rate Is Actually Good
For some pages, a high bounce rate is perfectly fine. A contact page with an 80 percent bounce rate is often a success. People land, find your phone number, and leave happy.
A blog post that answers one specific question completely can have a 90 percent bounce rate and still be working perfectly. The visitor got their answer and left satisfied.
When Low Bounce Rate Can Be a Warning
For other pages, a low bounce rate can actually be a warning sign. If visitors click through multiple pages because they cannot find what they need, that is not engagement. That is frustration.
The key is understanding what each page is supposed to do. If your page gives a complete answer or contains one clear action, a bounce is often a success. If your page is designed to lead visitors deeper into your site, then bounce rate matters more.
If you want to boost organic traffic with natural behavior patterns, the KeyUpSEO system creates real engagement signals including proper dwell time, scroll depth, and interaction. You can customize your order through the user panel and choose higher pages per session to keep bounce rates balanced and natural looking.
How to Measure Real Engagement on Your Pages
Now that we have covered why total visitors and bounce rate can mislead, let us look at metrics that actually tell you something useful.
Real engagement is about what visitors do after they arrive. Do they stay? Do they read? Do they click around? Do they come back?
There are several key metrics that help answer these questions. Each one looks at a different aspect of visitor behavior. Together, they give you a complete picture of how people actually interact with your site.
Some metrics tell you about attention, like how long people stay. Others show interest, like how many pages they visit. Some reveal loyalty, like how often they return. And one metric above all tells you whether your traffic actually pays off.
Let us walk through each of these metrics one by one.
Time on Page: A Real Indicator of Interest
Time on page is one of the most telling metrics you can track. It measures how long visitors spend reading or interacting with your content.
A short time usually means the page did not match what they expected. Maybe the title promised something the content did not deliver. Maybe the page was too slow to load. Maybe they simply were not interested.
A longer time suggests they found what they were looking for. They read, they scrolled, they engaged. This is a strong signal that your content is relevant and useful.
But here is what many people miss. Time on page alone does not tell you why someone stayed. They could have been distracted and left their browser open. Or they could have been deeply engaged.
That is why time on page works best when combined with other metrics. Scroll depth shows if they actually read. Pages per session shows if they wanted more. Conversions show if they took action.
Look at time on page alongside these other signals. Together, they tell you whether your content is actually working or just taking up space.
Scroll Depth: How Far Visitors Actually Read
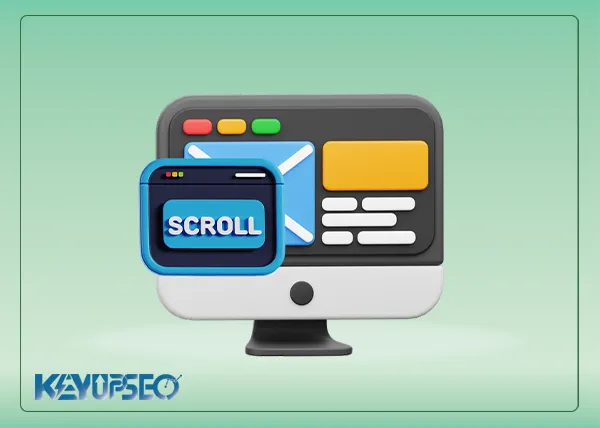
Scroll depth shows how far users scroll down your page. It is one of the clearest signs of whether your content actually holds attention.
Here is how it works. Twenty-five percent means they barely started. They saw the headline and maybe the first few sentences, then left. Fifty percent means they read about half. Seventy-five percent or more means they were genuinely interested and kept going.
If most users stop scrolling before fifty percent, your introduction may need work. The opening is not convincing enough to keep them reading. If they reach the bottom, your content is engaging and worth their time.
However, scroll depth can be misleading if your page is too long. A visitor who scrolls to the bottom of a short page may not have read much. A visitor who scrolls halfway down a very long page may have read more than the short-page visitor.
That is why scroll depth works best as a relative metric. Compare it across your pages rather than treating it as an absolute number. Pages with higher scroll depth are generally more engaging.
If you are wondering about the bigger picture, the article on does website traffic affect seo covers how metrics like scroll depth and engagement signal quality to search engines.
Pages Per Session: A Sign of Real Interest
Pages per session measures how many pages a visitor views during a single visit. It is a strong indicator of engagement and curiosity.
When someone lands on your site and clicks through to multiple pages, it shows they are interested in what you offer. They want to learn more. They are exploring. This is a clear sign of quality traffic.
When High Pages Per Session Is a Good Sign
A high pages per session number usually means your content is compelling and your internal linking is working. Visitors find one page useful and decide to check out others. They trust your site enough to keep going.
Aim for a steady increase in pages per session over time. This suggests your site is becoming more valuable and your visitors are finding more reasons to stay.
When High Pages Per Session Can Be Misleading
However, like all metrics, context matters. A high pages per session can also mean visitors are confused. They may be clicking around because they cannot find what they need.
This is why you should always check pages per session alongside other metrics like time on page and bounce rate. If visitors view many pages but spend very little time on each, they may be searching for something they cannot find. If they view many pages and spend good time on each, they are genuinely engaged.

Conversion Rate: The Metric That Actually Pays
This is the metric that separates traffic from revenue. Everything else we have discussed leads up to this.
Conversion rate measures the percentage of visitors who complete a desired action. That could be a purchase, a signup, a form submission, a phone call, or any other goal that matters to your business.
For example, if one hundred people visit your site and two make a purchase, your conversion rate is two percent.
Why Conversion Rate Matters More Than Traffic Volume
You can have ten thousand visitors and zero sales. You can also have one hundred visitors and five sales. Which one would you rather have?
Conversion rate tells you whether your traffic is actually working. It shows how well your site turns visitors into customers. This is the metric that directly impacts your bottom line.
A high conversion rate means you are attracting the right visitors and your site is doing its job. A low conversion rate means something is off.
How to Improve Your Conversion Rate
Start by checking your traffic sources. Some channels bring visitors who are ready to buy. Others bring visitors who are just browsing.
Next, look at your landing pages. Are they clear and relevant to what visitors expect? Do they have a strong call to action? Is the user experience smooth?
Small changes can make a big difference. A clearer headline, a faster loading page, a more visible button, or a simpler form can improve your conversion rate significantly.
To evaluate how well your pages are optimized for conversions, using on page seo checker tools with the KeyUpSEO system can help you identify technical issues that might be hurting your results.
Return Visitor Rate: The Loyalty Signal
Return visitor rate measures how many people come back to your site after their first visit. It is one of the strongest indicators of long term value.
When someone returns, it means they remembered you. They found something useful the first time and wanted more. They trust your content or your brand enough to come back.
Why Return Visitors Are More Valuable
Return visitors are easier to convert. They already know who you are. They have seen your content or your products before. They are further along in their decision journey than a first time visitor.
A high return visitor rate also reduces your reliance on new traffic. You spend less time and money acquiring new visitors because your existing audience keeps coming back.
What a Low Return Rate Tells You
If most of your visitors never come back, something is missing. Your content may not be valuable enough. Your site may not be memorable. You may not have given them a reason to return.
This does not mean your traffic is bad. It just means you are not building a relationship with your audience.
How to Increase Return Visits
Start with content that answers questions completely. Add value that keeps people coming back. Use email lists to remind visitors of new content. Offer resources that are useful over time.
When your return visitor rate grows, your site health grows with it. Loyal visitors are the foundation of sustainable growth.
Traffic Source Quality: Where Your Best Visitors Come From
Not all traffic sources are equal. Some bring visitors who stay, engage, and convert. Others bring visitors who leave within seconds. Understanding where your best visitors come from helps you invest your marketing budget wisely.
Why Source Quality Matters
A visitor from organic search is usually looking for something specific. They have intent. A visitor from social media might be browsing casually. A visitor from a referral link arrives with some trust already built.
Each source brings different types of visitors. Your job is to figure out which sources bring the visitors that actually matter to your business.
How to Identify Your Best Traffic Sources
Start by looking at your analytics. Compare sources by engagement metrics, not just visitor count. Look at time on page, pages per session, bounce rate, and conversion rate for each source.
Organic search often brings high quality visitors because they are actively searching for solutions. Direct traffic usually brings returning visitors who already know your brand. Referral traffic can bring targeted visitors if the referring site is relevant.
Social media traffic varies widely. Some platforms bring engaged visitors. Others bring casual browsers.
For a deeper look at how to track and compare these sources effectively, the guide on analyzing traffic sources in GA4 walks through the exact reports and settings you need.
What to Do With This Information
Once you know which sources perform best, shift your budget and effort toward them. Spend more time on channels that bring engaged visitors. Reduce time on channels that bring low quality traffic.
Traffic source quality is not fixed. It changes as your content, audience, and platforms evolve. Review it regularly and adjust your strategy accordingly.
How to Combine These Metrics for a Complete Picture
Looking at each metric alone gives you pieces of the puzzle. Combining them shows you the full picture.
The Engagement Triangle
Three metrics work together to show real engagement: time on page, scroll depth, and pages per session.
High time on page with deep scroll depth means people are actually reading your content. Add high pages per session, and you have visitors who are genuinely interested in what you offer.
Low time on page with shallow scroll depth means people are not engaging. Even if pages per session is high, they may be clicking around because they cannot find what they need.
The Quality Quadrant
Four metrics help you identify quality traffic: bounce rate, time on page, pages per session, and conversion rate.
Low bounce rate, high time on page, high pages per session, and high conversion rate is the ideal combination. This means visitors stay, engage, explore, and take action.
High bounce rate with everything else low means your traffic is not connecting. High bounce rate with high conversion rate means your page is doing its job perfectly. A contact page or a single-answer blog post fits this pattern.
How to Use These Combinations
Start with conversion rate. If conversions are good, your traffic quality is probably fine regardless of what other metrics show.
If conversions are low, look at the engagement triangle first. Are people staying and reading? If not, your content may not match their expectations. Fix that before you worry about anything else.
If engagement is good but conversions are still low, look at your calls to action and your user flow. The problem might be on your site, not your traffic.
Smart Metrics for Smarter Decisions
Stop looking at metrics in isolation. Start looking at them as a system. Each one tells part of the story. Together, they tell you what is actually happening on your site.
If you want to see how top brands approach their campaigns and what makes their traffic strategies work, Review the best advertising campaigns on the KeyUpSEO blog for practical examples you can apply to your own site.
Use this framework and you will stop guessing. You will know exactly where to focus your efforts.
Frequently Asked Questions
What is the most important metric for measuring traffic quality?
Conversion rate is the most important metric because it shows whether your visitors actually take action. However, it works best when combined with engagement metrics like time on page and pages per session.
Why does my site have high traffic but low sales?
High traffic with low sales usually means your visitors are not the right audience or your site is not converting them effectively. Check your traffic sources and review your landing pages, calls to action, and user experience.
How can I tell if my bounce rate is too high?
A high bounce rate is not always bad. For pages that give complete answers like blog posts or contact pages, it can be normal. For pages designed to lead visitors deeper, high bounce rate usually means your content or user experience needs improvement.
Which traffic source brings the highest quality visitors?
Organic search generally brings the highest quality visitors because users are actively searching for solutions. However, this varies by business. Track conversion rates by source to find what works best for your specific site.
Release date : 28 July, 2026